

PVGIS, the free European tool behind the winter yield numbers in our own guides, lists irradiance, sun height, temperature, wind and power in its hourly output. Snow isn't a column. So every winter figure built on it quietly assumes the glass is bare.
That's fine in Berlin. Is it fine in Oslo, or Minneapolis? I wanted a number, so I built the missing column.
What follows is a model, not a measurement. No metered roof stands behind any of this. What I did run is about 450 lines of Node that joins hourly PVGIS output to hourly ERA5 snowfall for six places, then applies the snow-coverage model NREL built into its System Advisor Model. Our guides on panels in cold weather and winter dips versus degradation cover the light and the weather noise. This one covers the white stuff.
What Did I Actually Run?
Five tilts (10, 20, 35, 50 and 65 degrees), one kWp, south-facing, 14% system losses, hour by hour from 2005 to 2023. Berlin, Munich, Oslo and Helsinki use PVGIS 5.3 with the SARAH3 radiation database. Minneapolis and Boulder use the PVGIS-ERA5 database instead, because SARAH3 doesn't reach North America. Snowfall and snow depth on the ground come from Open-Meteo's historical API, which serves ERA5 reanalysis.
Then the snow part. NREL's Ryberg and Freeman report describes the model, and pvlib publishes the same logic as open source. I re-implemented it in JavaScript, then checked my port against pvlib's own snow.py on the Minneapolis input: three tilts, two thresholds, annual losses within 0.1 percentage point. Boring, and exactly what a port should be.
The script, the fetcher and the raw output are in the blog's examples/winter-snow-loss-model/ folder, and every number below is from that results.txt.
How Does the Model Decide a Panel Is Buried?
Four rules, all hourly.
- An hour with snowfall above a threshold, and at least 1 cm of snow on the ground, covers the whole slant height of the array.
- Snow slides only when the air is warm enough for the light on the panel. The test is air temperature above minus plane-of-array irradiance divided by 80. At 400 W/m2 of sun, anything warmer than minus 5 C lets it go.
- It slides at 0.197 of the slant height per hour times the sine of the tilt. That's the coefficient in pvlib's source. At 35 degrees, a fully buried array is clear after roughly 9 hours of sun-warmed time. At 10 degrees it's 29.
- When the snow on the ground drops under 1 cm, whatever is left falls off at once.
Loss is the covered fraction, rounded up to whole cell strings. One string along the slant height means one covered cell kills the lot.
Where I Had to Make a Judgment Call
The pvlib default for the threshold is 1 cm of snowfall per hour. My snowfall comes from a reanalysis grid, not a weather station, and a grid cell smooths intensity away. Minneapolis sees 13 hours a year above 1 cm in my data, and the model then returns 3.7% annual loss at 20 degrees. NREL's national study tabulates 10.7% for Minneapolis at that tilt.
So I swept the threshold. At 0.5 cm/h the model gives 8.2% for Minneapolis against NREL's 10.7%, and 7.5% for Boulder against NREL's 5.5%. No single value fits both: 23% under in one city, 36% over in the other. (Boulder's grid cell probably catches foothill snow. I haven't checked.) I kept 0.5 and report the 0.3 and 1.0 results beside it. Treat every absolute figure below as a range, not a point.
How Much of the Year Does Snow Take?
Less than most people fear, and wildly different by place.
| City | Days with 1 cm+ on the ground, per year | Annual loss at 20 / 35 / 50 degrees | Worst year at 20 degrees |
|---|---|---|---|
| Berlin | 50 | 0.4 / 0.3 / 0.2% | 2.4% |
| Munich | 96 | 1.3 / 0.9 / 0.7% | 3.8% |
| Helsinki | 132 | 2.1 / 1.8 / 1.8% | 5.0% |
| Oslo | 147 | 2.6 / 1.9 / 1.6% | 9.7% |
| Boulder | 156 | 7.5 / 5.0 / 4.1% | 11.4% |
| Minneapolis | 136 | 8.2 / 6.5 / 5.7% | 20.6% |
Two things jump out. Oslo has more snow-cover days than Minneapolis and loses less than a third as much. The reason is arithmetic: only 6% of an Oslo roof's year is made from December to February at 20 degrees, against 18% in Minneapolis, so a heavy bite out of a thin slice stays small. And the worst year runs 1.5 to 6 times the average, depending on the city. A calculator that applies a flat "3% snow derate" is too high for Munich and too low for Minneapolis, in the same breath.
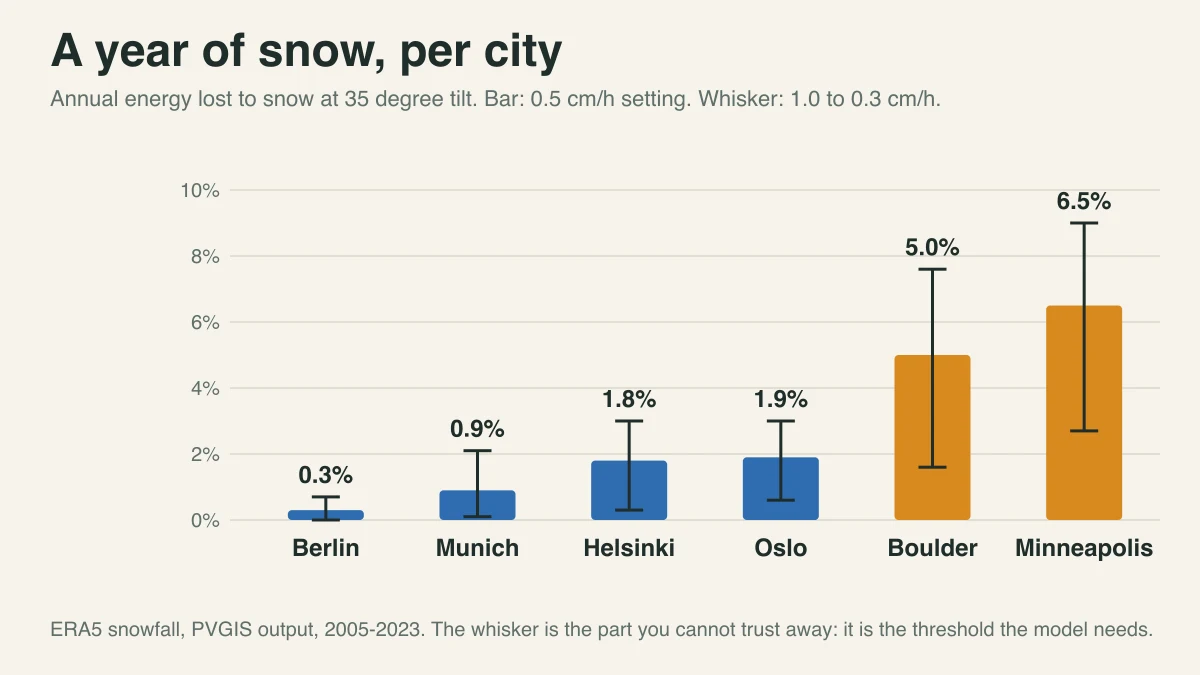
Boulder and Minneapolis are the two I can compare with a published table, and I'd call the agreement decent rather than good. NREL's national study ran fixed-tilt systems across the US and found 0% to 16% annual loss, with 20 degree arrays losing more than tilt-equals-latitude ones. My model loses more at 20 degrees than at steeper tilts in all six cities, which is the same ordering.
Why Does Winter Take the Real Beating?
Because snow and the dark months arrive together. Over a year, a 20 degree array in Minneapolis loses 8.2%. Over December to February alone it loses 35.6%, and that's the season when the yield was already thin.
| City | Dec-Feb loss at 20 degrees | Dec-Feb loss at 50 degrees |
|---|---|---|
| Berlin | 2.6% | 1.5% |
| Munich | 7.6% | 3.6% |
| Boulder | 19.0% | 8.7% |
| Helsinki | 27.2% | 19.2% |
| Oslo | 28.1% | 13.8% |
| Minneapolis | 35.6% | 22.1% |
At 20 degrees in Oslo, 5.4% of all daylight hours in the year have snow on at least part of the array. In Berlin it's 0.9%. I didn't expect that second number to be so small. Berlin's winter problem is gloom, not snow, and the 2.2-fold gap between its darkest and brightest December in the degradation piece dwarfs anything a snowfall does to it.
Does a Steeper Roof Beat the Snow?
In snow country, yes, and by more than the usual tilt arithmetic says. Our cold-weather guide shows that in Berlin a 60 degree tilt lifts December by about a fifth and costs 4% over the year. Snow changes that bargain.
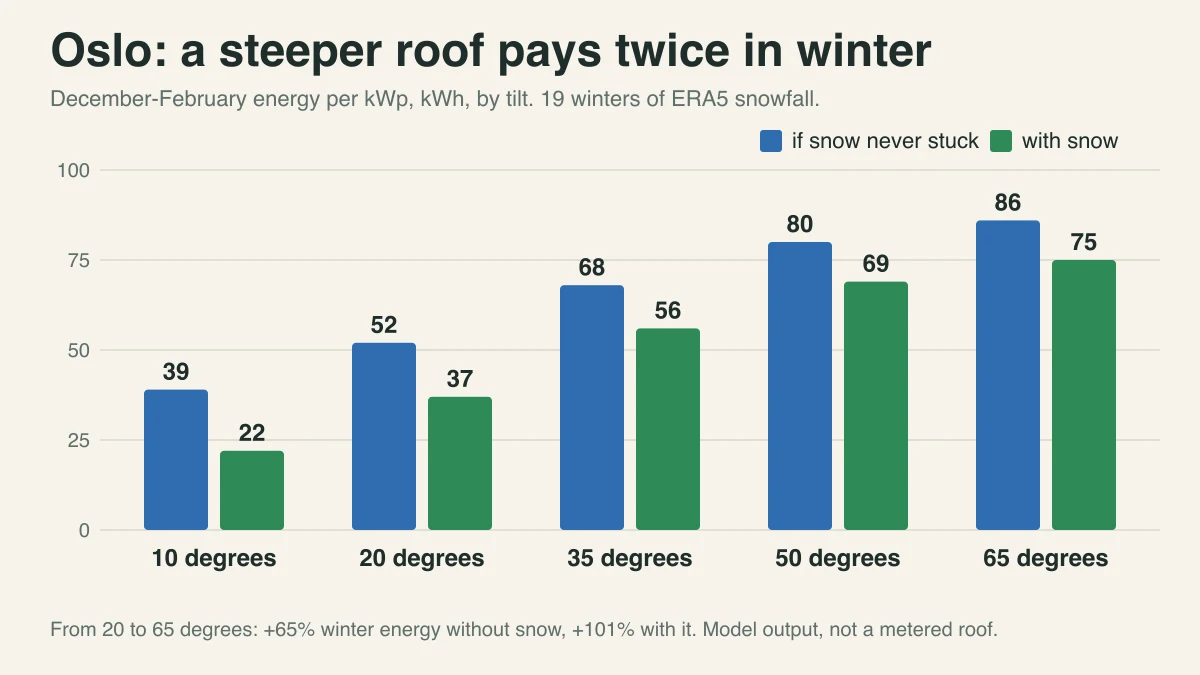
Going from 20 to 65 degrees in Oslo lifts winter energy by 65% on bare glass. With snow counted it's 101%, because the steep roof gains light and sheds its cover faster. The annual total also moves the other way from the Berlin pattern: plus 3.8% in Oslo, plus 1.2% in Helsinki, plus 1.6% in Minneapolis. In Berlin and Munich, where little snow falls, the steep roof still loses 2.8% and 3.2% of the year.
In Oslo, snow turns a steeper roof from a 65% winter gain into a 101% one, and the annual total goes up instead of down.
My opinion, which installers selling flat-roof ballast systems will dislike: at Oslo or Helsinki latitudes, or anywhere with a month of lying snow, a 10 degree ballasted array is the wrong default. The model's best annual tilt in Oslo and Helsinki is 50 degrees with or without snow. In Minneapolis it moves from 35 to 50 once snow is in, though the two differ by 4 kWh per kWp a year, which is a tie. A 10 degree tilt is not a tie: it ends the year with 1,128 kWh per kWp against 1,337 at 35 degrees.
Do Portrait and Landscape Lose the Same?
Not in the model, and the gap is bigger than I guessed. The loss calculation rounds covered height up to whole cell strings in parallel along the slant height. With one string, any snow on the bottom edge counts as a full loss. With three, a thin band at the bottom costs a third. The pvlib documentation describes a 60-cell module mounted in portrait as one string along the slant height and the same module in landscape as three.
In Minneapolis at 20 degrees, going from one string to three cut annual loss from 8.2% to 6.6% and the December-to-February loss from 35.6% to 29.8%. That's a fifth off the annual figure from nothing but module orientation and wiring. How your actual modules split into strings and bypass diodes is a datasheet question I haven't verified for any specific model, so treat this as a reason to ask, not a rule.
Is Clearing the Snow Worth It?
For a fixed array, almost never. Take a 20 degree roof in Minneapolis. The model has it making 1,359 kWh per kWp on bare glass and 1,247 with snow, a gap of 112 kWh. For an 8 kWp system that's about 900 kWh a year. At an assumed 15 cents a kWh (my number, not a tariff), that's roughly 135 dollars, and it's the ceiling: you'd have to clear every fall, instantly. In Oslo at 20 degrees the gap is 23 kWh per kWp. Nobody should risk an icy ladder for 184 kWh on the same 8 kWp.
The cold-weather guide already covers the physical side, with a soft roof rake from the ground as the only method I'd consider. The model only adds the arithmetic. If your loss is big, the better fix was a steeper tilt on the day you designed the roof.
How Far Can You Trust This?
Further for comparisons than for totals. The ordering of cities, the tilt effect and the winter concentration hold across all three thresholds I tried. The exact percentages don't: the 35 degree Minneapolis figure runs from 2.7% to 9.0% across them.
The model's authors say the same thing. NREL's report notes that Marion's original work performs well on an annual average, but that large differences between modeled and measured loss should be expected for monthly or shorter periods. So don't take my December numbers as forecasts. Also missing: wind clearing, melt from the module's own heat, refreezing that glues the bottom row, drifts piling against the lower edge, and the brightening from snow on the ground, since PVGIS keeps its default albedo. Snow depth from ERA5-Land tends to be overestimated, according to Open-Meteo's own documentation, which should push my losses up. Two of those errors point in opposite directions, and I can't tell you which wins.
If you're pricing a system in snow country, run the script with your coordinates, then ask your installer for the snow-loss derate they used. A single flat number with no tilt attached is a guess. What would yours say?